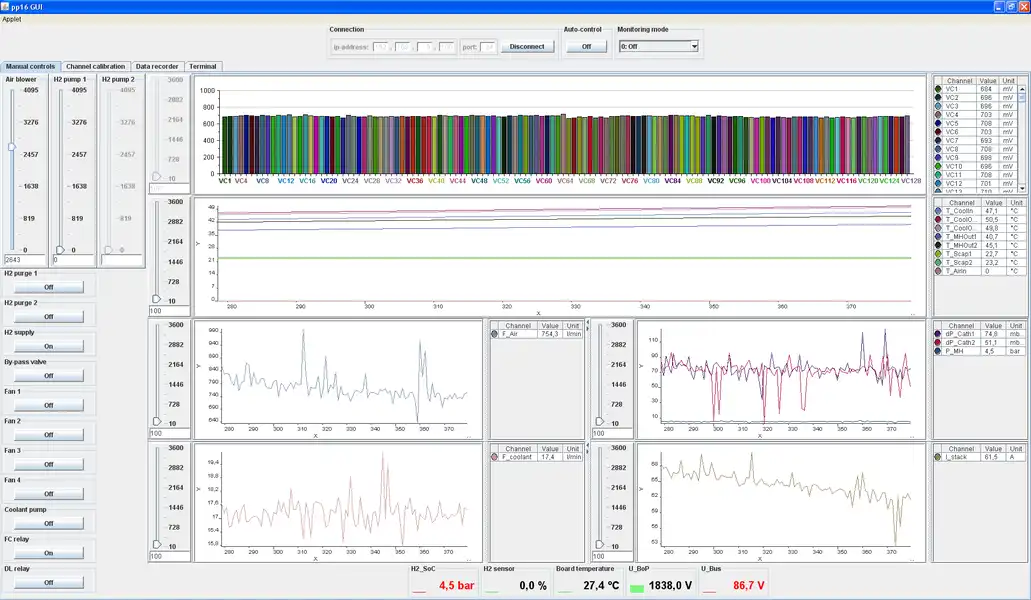
This is the Windows app named JChart2D to run in Windows online over Linux online whose latest release can be downloaded as jchart2d-3.2.2.zip. It can be run online in the free hosting provider OnWorks for workstations.
Download and run online this app named JChart2D to run in Windows online over Linux online with OnWorks for free.
Follow these instructions in order to run this app:
- 1. Downloaded this application in your PC.
- 2. Enter in our file manager https://www.onworks.net/myfiles.php?username=XXXXX with the username that you want.
- 3. Upload this application in such filemanager.
- 4. Start any OS OnWorks online emulator from this website, but better Windows online emulator.
- 5. From the OnWorks Windows OS you have just started, goto our file manager https://www.onworks.net/myfiles.php?username=XXXXX with the username that you want.
- 6. Download the application and install it.
- 7. Download Wine from your Linux distributions software repositories. Once installed, you can then double-click the app to run them with Wine. You can also try PlayOnLinux, a fancy interface over Wine that will help you install popular Windows programs and games.
Wine is a way to run Windows software on Linux, but with no Windows required. Wine is an open-source Windows compatibility layer that can run Windows programs directly on any Linux desktop. Essentially, Wine is trying to re-implement enough of Windows from scratch so that it can run all those Windows applications without actually needing Windows.
SCREENSHOTS:
JChart2D to run in Windows online over Linux online
DESCRIPTION:
JChart2D is a easy to use component for displaying two- dimensional traces in a coordinate system written in Java. It supports real-time (animated) charting, custom trace rendering, Multithreading, viewports, automatic scaling and labels.Former UI controls (right click context menu, file menu) have been ported to the subproject jchart2d-uimenu (https://sourceforge.net/projects/jchart2d-uimenu.jchart2d.p/) for the benefit of having no dependencies to 3rd party libraries.
Features
- Easy usage: only a few lines of code are necessary to use a chart. No complex specification of data points, labels or grids necessary. This is done per default and may optionally be configured.
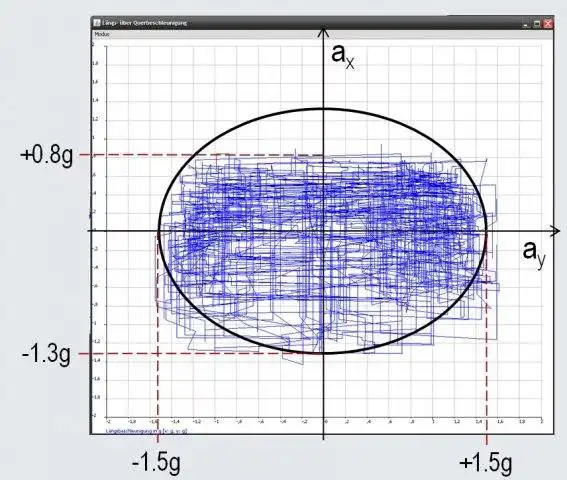
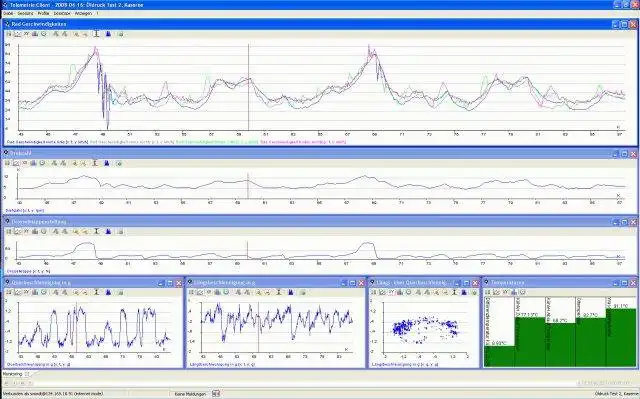
- Real time performance (e.g. for telemetry at www.lionsracing.de)
- Multiple traces with different behavior may be added to a single chart.
- Automatic choice of the unit - prefix (multiplier) according to the scientific unit system (nano , milli, tera, ..).
- Label formatter for scale labels via java.text.NumberFormat or java.text.DateFormat.
- Chooseable display of grids, labels, labeled scalepoints, coordinate tooltips, ... .
- Traces may be rendered via lines, discs, dots (is a disc with radius 1) or filled polygons. Additionally strokes may be specified (only useful for lines I think). An open interface for further graphical representations of traces exists.
- Different axis implementations (settable from UI): linear, log e and log 10.
- Multiple axes on top,bottom, left and right side. Traces may be assigned to an x and an y axis that has been assigned to the chart and will be related to them.
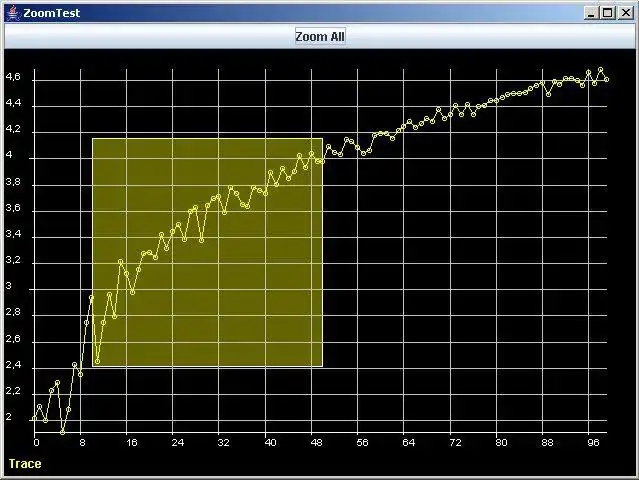
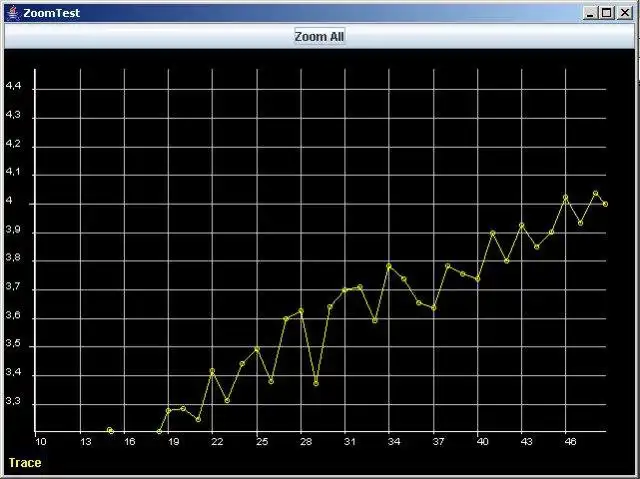
- Different viewport implementations: Zooming (ZoomableChart), enforcing visible bounds even if data does not fill them,...
- Exact visualisation of labeled scalepoints. No label of a scalepoint is ever rounded to the next current chosen decimal, instead the scalepoint is shifted to a position which represents an exact decimal.
- Fully resizable. The amount of labeled scalepoints may increase on choosing a bigger size.
- Deadlock - safe. Even this is hard to claim because testing depends on runtime behaviour of the current system, i did not encounter a deadlock situation while letting several threads modifiy traces all contained in the same chart (only the awt painting system may get pretty busy).
- Trace - implementations with different behaviour: unordered, ringbuffered, ordered, bijective, ...
- Highly configurable error bar API.
- Charts may be saved as images (jpeg, gif, jpg,... depending on the image writers of the java VM implementation), a snapshot UI control allows this.
- Charts may be saved as encapsulated postscript files (eps) thanks to Apache XML Graphics Commons.
- Charts may be printed (which allows to print them to a pdf driver too).
Audience
Developers, Education, Science/Research
User interface
Java AWT, Java Swing
Programming Language
Java
This is an application that can also be fetched from https://sourceforge.net/projects/jchart2d/. It has been hosted in OnWorks in order to be run online in an easiest way from one of our free Operative Systems.

