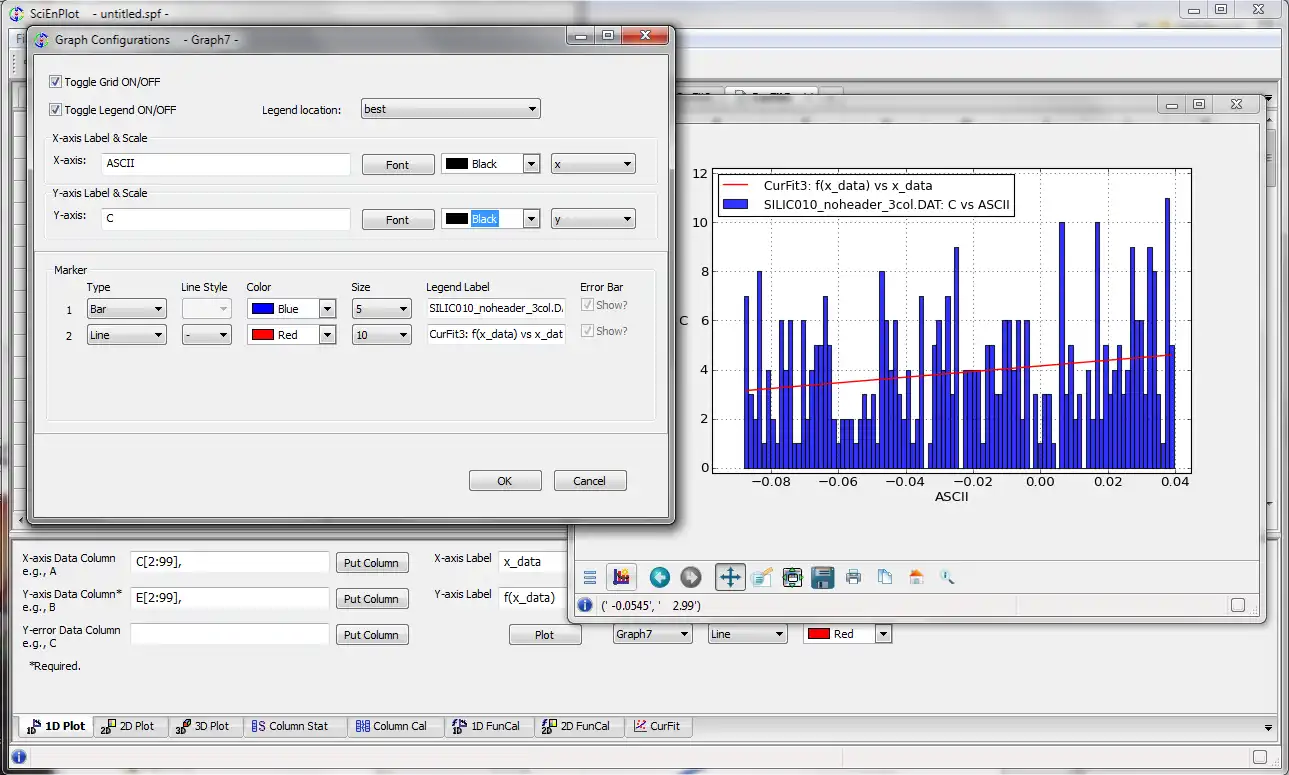
This is the Windows app named SciEnPlot to run in Windows online over Linux online whose latest release can be downloaded as SciEnPlot-1.3.6-mac.zip. It can be run online in the free hosting provider OnWorks for workstations.
Download and run online this app named SciEnPlot to run in Windows online over Linux online with OnWorks for free.
Follow these instructions in order to run this app:
- 1. Downloaded this application in your PC.
- 2. Enter in our file manager https://www.onworks.net/myfiles.php?username=XXXXX with the username that you want.
- 3. Upload this application in such filemanager.
- 4. Start any OS OnWorks online emulator from this website, but better Windows online emulator.
- 5. From the OnWorks Windows OS you have just started, goto our file manager https://www.onworks.net/myfiles.php?username=XXXXX with the username that you want.
- 6. Download the application and install it.
- 7. Download Wine from your Linux distributions software repositories. Once installed, you can then double-click the app to run them with Wine. You can also try PlayOnLinux, a fancy interface over Wine that will help you install popular Windows programs and games.
Wine is a way to run Windows software on Linux, but with no Windows required. Wine is an open-source Windows compatibility layer that can run Windows programs directly on any Linux desktop. Essentially, Wine is trying to re-implement enough of Windows from scratch so that it can run all those Windows applications without actually needing Windows.
SCREENSHOTS
Ad
SciEnPlot to run in Windows online over Linux online
DESCRIPTION
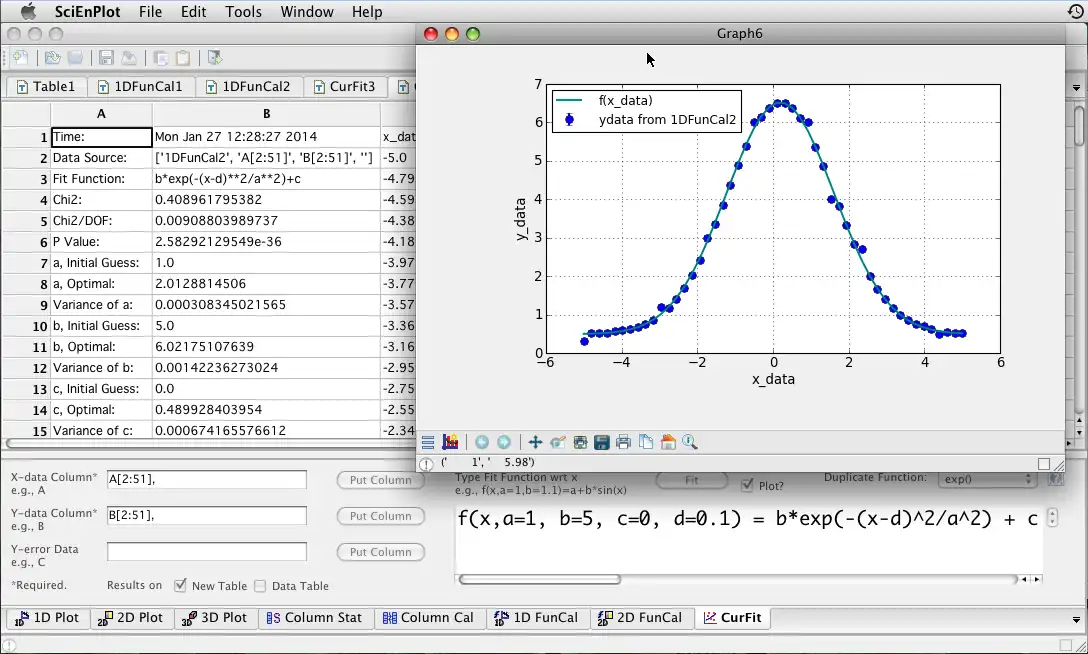
- Save and open a Work/Project (spf) file- Single fitting/ Batch fitting (user defined custom func)
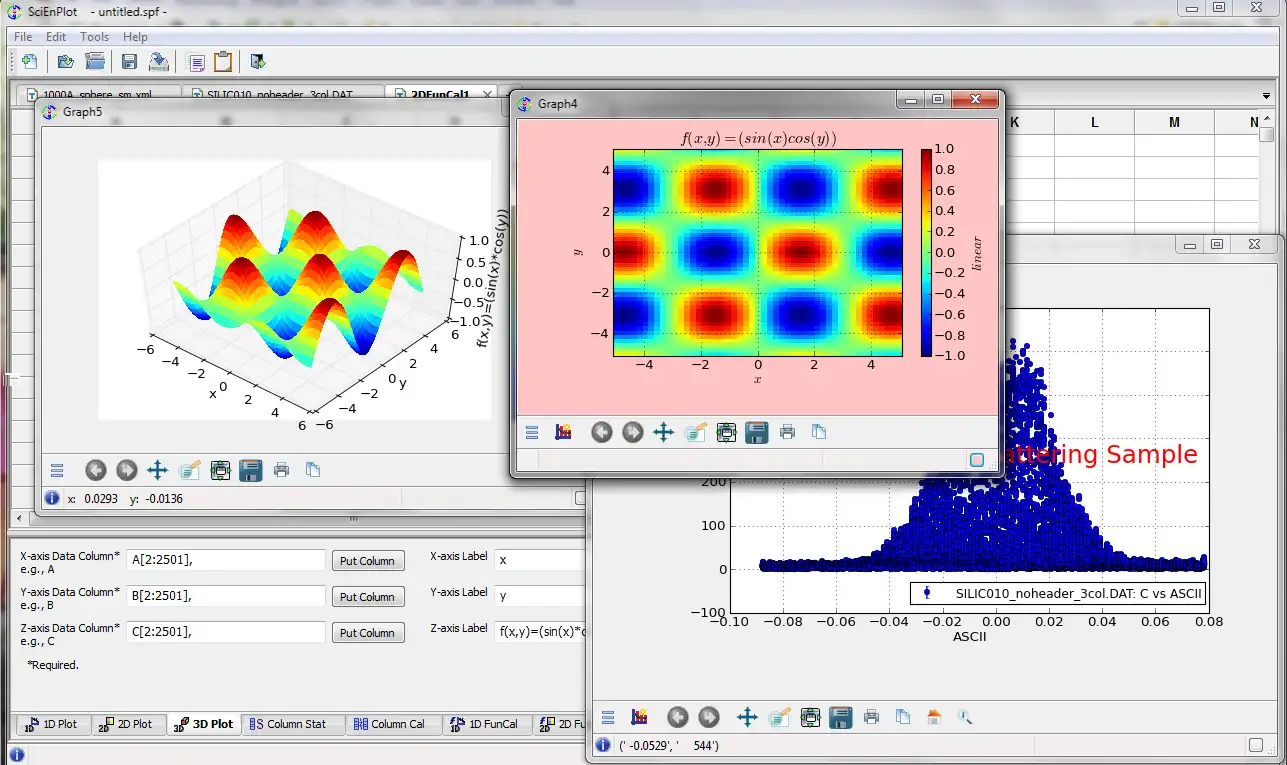
- Matrix to XYZ in Tool menu
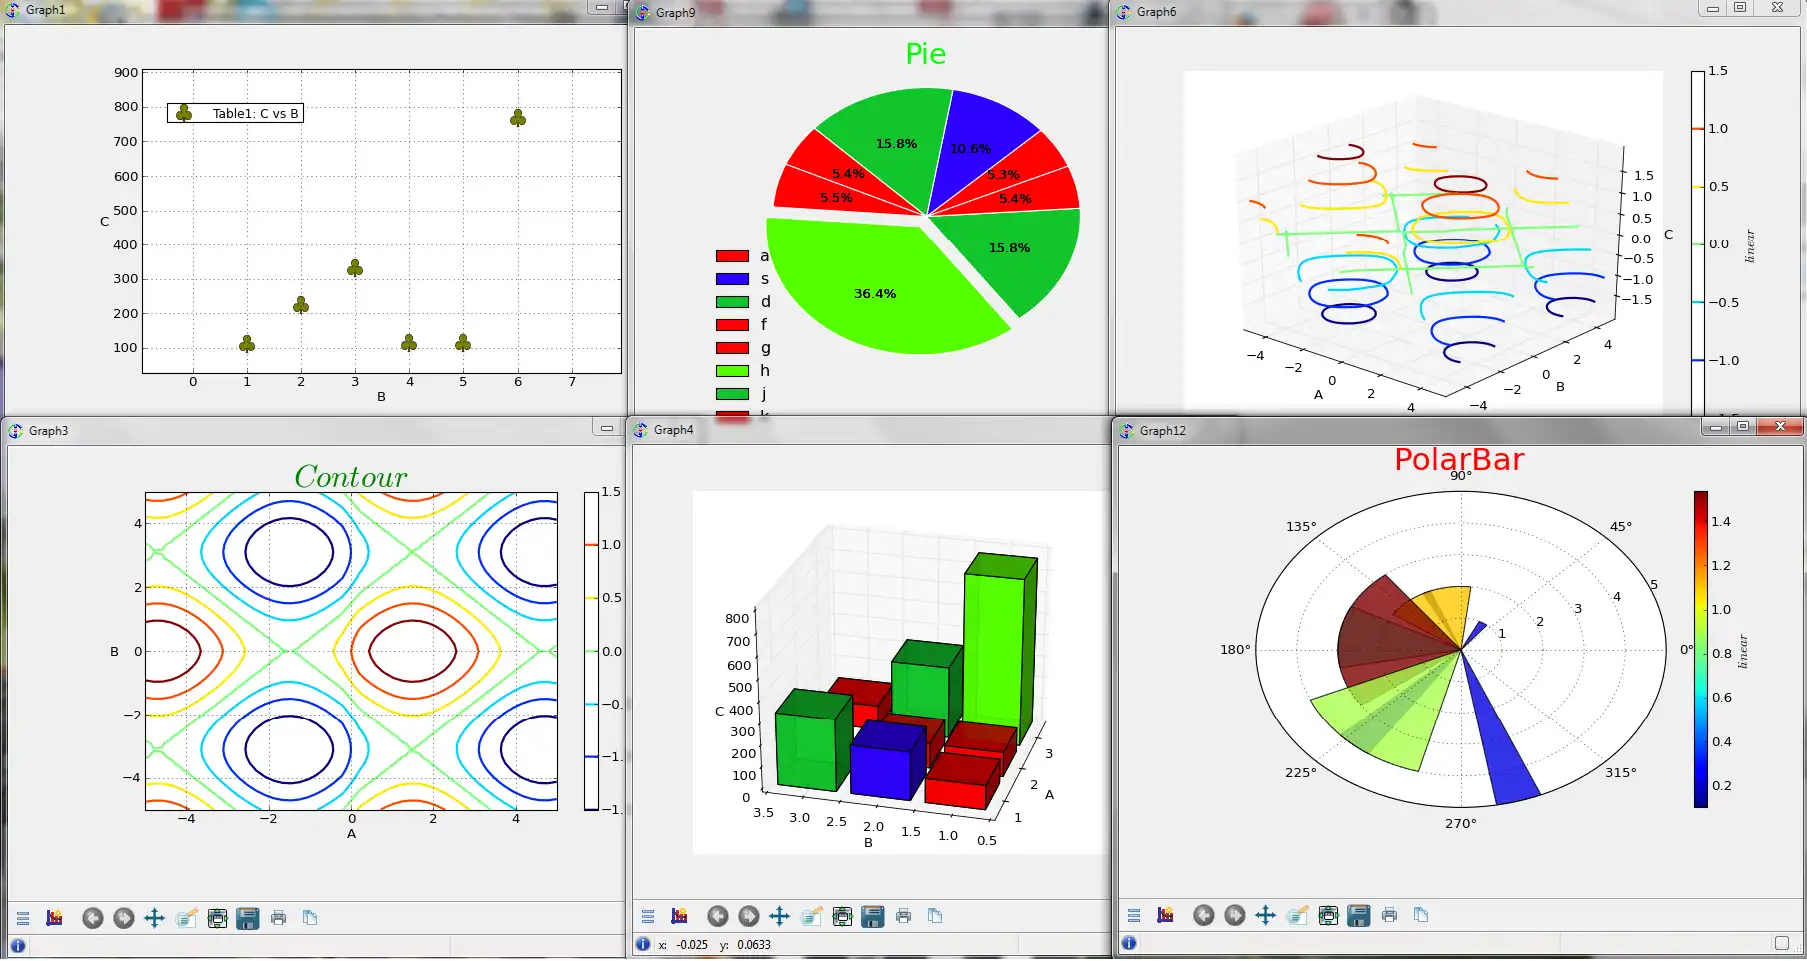
- Symbol plot: makers, curve, landscape, bar, etc.
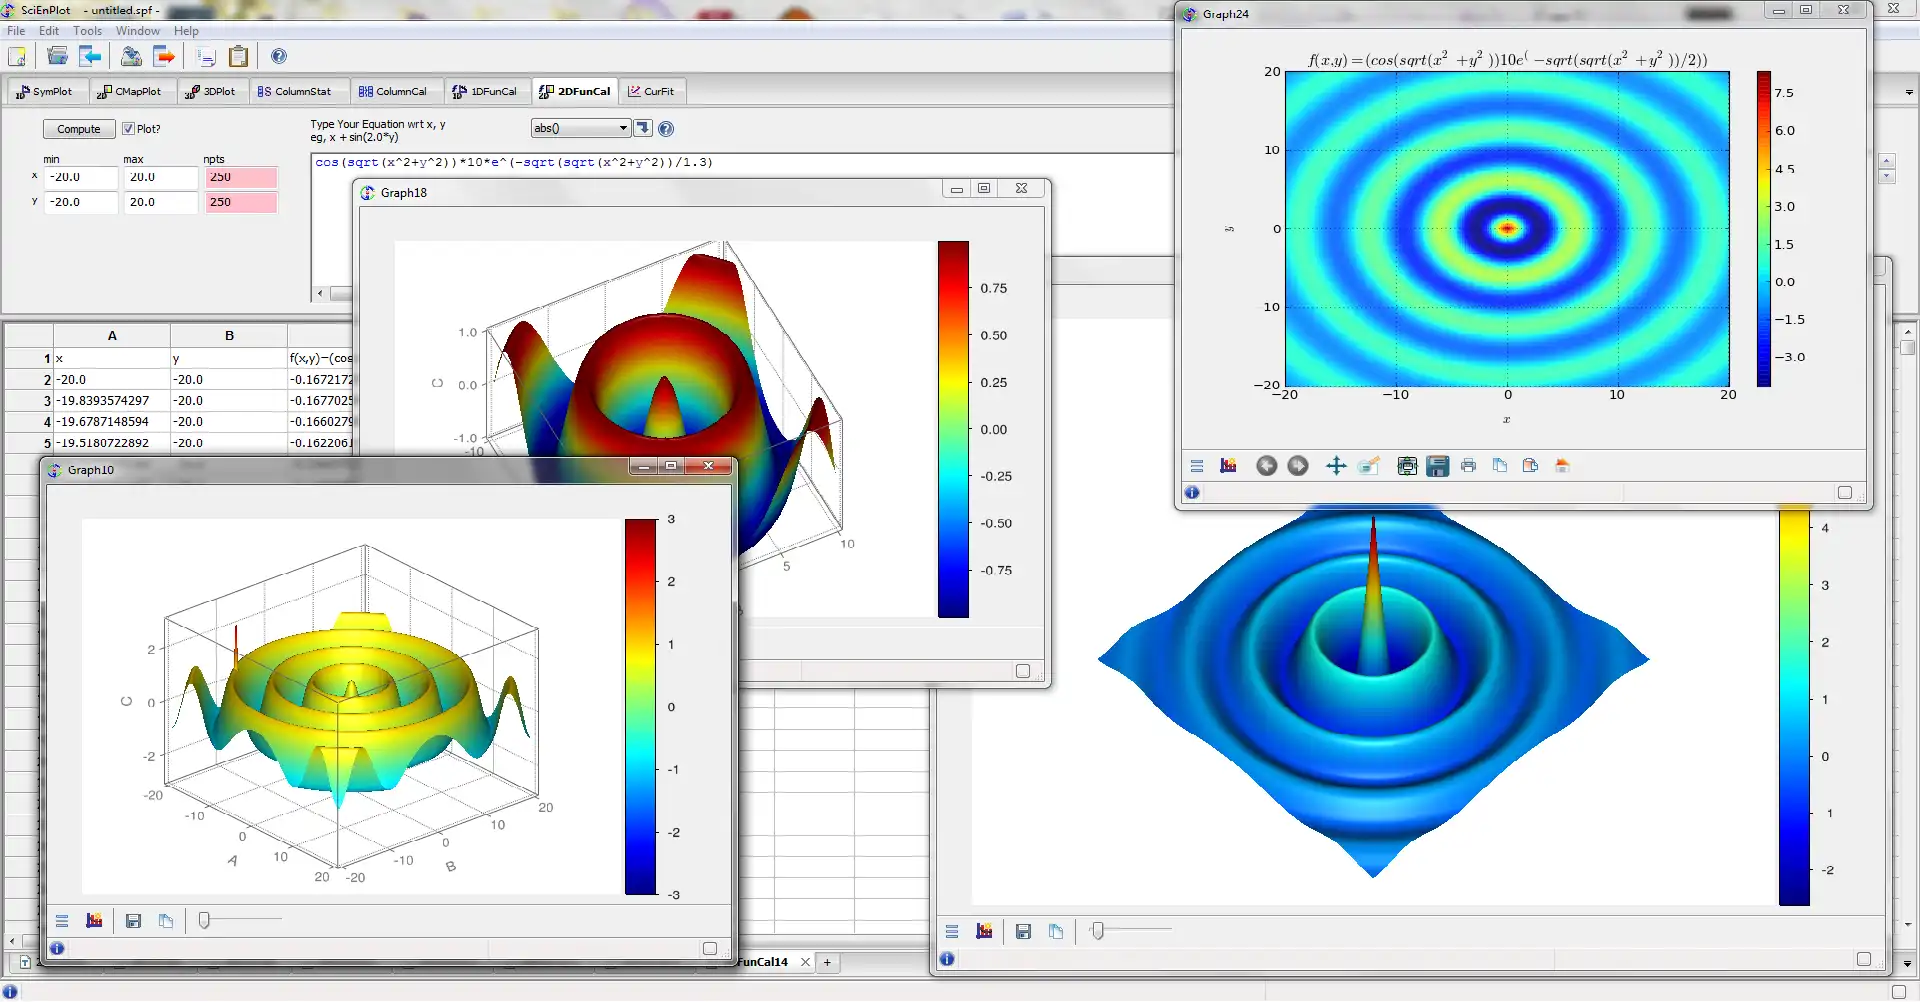
- Implemented a 3d surface plot (GLSurface) based on OpenGL (ScienPlot v1.3.2 and above)
- ColorMap surface, trisurface, Pie, Polar plots, and 3D height field, 3dBar, scatter plots (under developing), and more
- Column by column plotting/calculation
- LaTex commands enclosed by $ symbols can be used for the labels in Graph
- Accept txt(Text) and csv(Comma separated values) formatted data
- Save, copy, print Graph
- Use spread sheets to display data
- Textboard to organize the results
- Graphs in a publishable quality
- Source codes based on:
Python Numpy Scipy Matplotlib WxPython Visvis etc.
- Special functions
- Drag and drop data files
- Python console is back (since v1.3.3), capable of reusing column data
- Debye and Guinier models for SANS / SAX data
- More apps in our Web below
Audience
Science/Research, Education, End Users/Desktop, Engineering
User interface
Win32 (MS Windows), Cocoa (MacOS X), Carbon (Mac OS X)
Programming Language
Python
Database Environment
Python Database API
This is an application that can also be fetched from https://sourceforge.net/projects/scienplot/. It has been hosted in OnWorks in order to be run online in an easiest way from one of our free Operative Systems.

